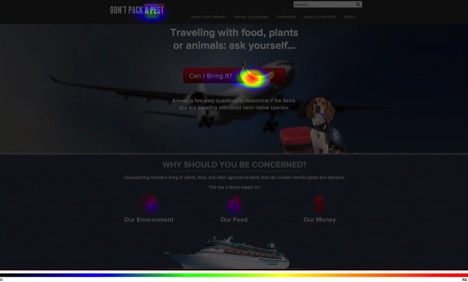
 This heat map from a website usability test shows that more people click on the banana image than anywhere else on the computer screen, followed by the button at the top of the screenshot. This tool allows Extension faculty to determine the ease of respondent use of the communication material. This 6-page fact sheet explains how to use heat maps and how to develop heat map questions in Qualtrics. Written by Laura M. Gorham, Shuyang Qu, Ricky Telg, and Alexa Lamm, and published by the UF Department of Agricultural Education and Communication, February 2015.
http://edis.ifas.ufl.edu/wc198