Estasyon Meteyo nan Jaden: Gid pou Enstalasyon ak Antretyen

Palm trees being blown by the winds of an approaching storm. Severe weather, rain, beach, coast. UF/IFAS Photo by Tyler Jones.

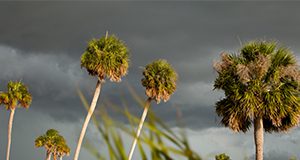
Kondisyon meteyo yo ka jwe yon gwo wòl nan siksè oswa echèk aktivite agrikòl yo. Kiltivatè yo rekonèt sa e se sak fè yo toujou swiv bilten ak previzyon meteyo pou ka ede yo pran desizyon nan sa ki gen pou wè ak irigasyon, pwoteksyon kont fredi ansanm ak anpil lòt desizyon. This new 4-page publication is the Haitian Creole version of EDIS document AE532, Guidelines for Establishing and Maintaining Farm-Based Weather Stations in Haiti. Written by Caroline G. Staub, William Eisenstadt, William Blanc, Nicole Monval, Clyde W. Fraisse, William Lusher, George Braun, and Lee Staudt, and published by the UF/IFAS Department of Agricultural and Biological Engineering, May 2019.
http://edis.ifas.ufl.edu/ae531

Guidelines for Establishing and Maintaining Farm-Based Weather Stations in Haiti

Palm trees being blown by the winds of an approaching storm. Severe weather, rain, beach, coast. UF/IFAS Photo by Tyler Jones.

Weather can significantly influence the success or failure of agricultural enterprises. Monitoring weather conditions can provide critical decision-making information. This new 4-page publication provides Haitian farmers with basic guidelines for installing and maintaining an on-farm weather station. Written by Caroline G. Staub, William Eisenstadt, William Blanc, Nicole Monval, Clyde W. Fraisse, William Lusher, George Braun, and Lee Staudt, and published by the UF/IFAS Department of Agricultural and Biological Engineering, May 2019.
http://edis.ifas.ufl.edu/ae532

Degree-Days: Growing, Heating, and Cooling

Corn stalks growing in a field

How much and when it rains, freezes, and thaws can make the difference between boom and bust for a year's crop. However, temperature can predict more than boom or bust. Atmospheric temperature can predict the growth rates of many plants. For this reason, growers use a concept called growing degree-days (GDD), sometimes called heat units. This 5-page document discusses growing degree-days, use of the AgroClimate website to track and forecast GDD accumulation, heating and cooling degree-days, and methods for calculating HDD, CDD, and GDD. Written by Clyde W. Fraisse and Silvana V. Paula-Moraes, and published by the UF/IFAS Department of Agricultural and Biological Engineering, revised December 2010 and April 2018.
http://edis.ifas.ufl.edu/ae428

AgroClimate Crop Season Planning Tool: Reducing the Risk of Extreme Weather Events During Key Stages of Crop Development

Storm rising over a farm.

This 5-page publication details a new tool available to growers and Extension professionals to manage risks related to climate during seasonal planning stages. The Crop Season Planning tool is a climate-based tool that enables growers to plan planting strategies that will minimize risk to climate extremes based on historical climate data at their location. Written by Caroline G. Staub, Daniel Perondi, Diego Noleto Luz Pequeno, Patrick Troy, Michael J. Mulvaney, Calvin Perry, Brian Hayes, Willingthon Pavan, and Clyde W. Fraisse, and published by the UF/IFAS Department of Agricultural and Biological Engineering, March 2018.
http://edis.ifas.ufl.edu/ae525

Smart Strawberry Advisory System for Mobile Devices

Freshly harvested strawberries.Like the web-based SAS, the SAS: Strawberry Advisory System mobile app monitors real-time and forecast weather conditions that increase the risk for Botrytis (gray mold) and anthracnose fruit rots, providing risk level information for each disease. The app provides easy access to the information growers need to make spraying decisions in the field, saving them time, helping improve disease control, and avoiding unnecessary fungicide applications. This 3-page fact sheet provides an overview of the SAS mobile app. Written by Clyde W. Fraisse, Natalia Peres, and José Henrique Andreis, and published by the UF Department of Agricultural and Biological Engineering, August 2015.
http://edis.ifas.ufl.edu/ae516

SmartIrrigation Avocado App: A Step-by-Step Guide

Figure 1. SmartIrrigation Avocado app iconUF’s SmartIrrigation Avocado for iOS and Android platforms provides a simple ET-based method to schedule irrigation and is expected to provide 20% to 50% water savings based on findings with other schedule tools. This 6-page fact sheet provides configuration instructions and main menu features. Written by D. Mbabazi, K. W. Migliaccio, J. H. Crane, J. H. Debastiani Andreis, C. Fraisse, L. Zotarelli, and K. T. Morgan, and published by the UF Department of Agricultural and Biological Engineering, May 2015.
http://edis.ifas.ufl.edu/ae513

Your Farm Weather Station: Installation and Maintenance Guidelines

Figure 1. ET107 model weather station. Credit: Campbell ScientificWeather is a prominent factor in the success or failure of agricultural enterprises, and the technology is improved and less expensive, so many farmers are installing farm-based weather stations for tracking weather conditions, scheduling irrigation, make decisions related to cold protection, and accomplish other tasks. But management decisions must be based on high-quality observations. Sensors must meet accepted minimum accuracy standards, the station must be sited properly and well-maintained.
This 5-page fact sheet provides farmers with basic guidelines for installing and maintaining a weather station. Written by Clyde W. Fraisse, George W. Braun, William R. Lusher, and Lee R. Staudt, and published by the UF Department of Agricultural and Biological Engineering, April 2015.
http://edis.ifas.ufl.edu/ae502

Smartirrigation Apps: Urban Turf

Figure 1.  Login and registration screens for the Smartirrigation Turf app. Credit: J. H. Debastiani Andreis
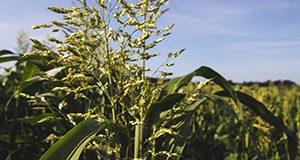
We developed an app called Smartirrigation Turf to provide an easy-to-use mobile tool that delivers information to improve irrigation scheduling for urban turf. Using the app instead of a set time-based schedule for irrigation, homeowners and others can provide irrigation amounts to turf that more closely match water needs. This version of the app is applicable in Florida and Georgia and is available to download in the Apple App Store and Google Play Store. This 5-page fact sheet was written by K. W. Migliaccio, J. H. Debastiani Andreis, C. Fraisse, K. T. Morgan, and G. Vellidis, and published by the UF Department of Agricultural and Biological Engineering, October 2013.
http://edis.ifas.ufl.edu/ae499

Opciones de gestion agronomica para la variabilidad y para el cambio climatico: El riego localizado (HS1212)

Figure 1. Riego por goteo aplicado a la superficie para la producción de fresas. Créditos: Lincoln ZotarelliEsta publicación se enfoca en el uso del riego localizado para mejorar los sistemas de producción. This 5-page fact sheet was written by Lincoln Zotarelli, Clyde Fraisse, and Daniel Dourte, and published by the UF Department of Horticultural Sciences, January 2013.
http://edis.ifas.ufl.edu/hs1212

Agricultural Management Options for Climate Variability and Change: High-Residue Cover Crops (AE488)

Figure 2. Custom roller/strip-till implement by Myron Johnson of Headland, Alabama. While decision making in agriculture involves many aspects beyond climate, including economics, social factors, and policy considerations, climate-related risks are a primary source of yield and income variability. This 4-page fact sheet focuses on the use of high-biomass winter cover crops to improve production systems. Written by Joel Love, Jed Dillard, Kirk Brock, Daniel Dourte, and Clyde Fraisse, and published by the UF Department of Agricultural and Biological Engineering, August 2012.
http://edis.ifas.ufl.edu/ae488

Agricultural Management Options for Climate Variability and Change: Sod-Based Rotation (AE492)

A sod-based rotation is when a producer adapts a conventional peanut/cotton rotation by growing a perennial grass, such as bahiagrass, during two years of the rotation. The perennial grass can be grazed, cut for hay or harvested for seed for additional income. Using a sod-based rotation can improve soil water-holding capacity and potentially reduce impacts of dry spells and droughts. This 4-page fact sheet was written by David Wright, Jim Marois, Clyde Fraisse, and Daniel Dourte, and published by the UF Department of Agricultural and Biological Engineering, August 2012. http://edis.ifas.ufl.edu/ae492

Agricultural Management Options for Climate Variability and Change: AgroClimate (AE491)

AgroClimate is a website providing climate information and decision-support tools to producers throughout the Southeastern United States. With information from the site, producers can develop a strategy for the coming season and track climate conditions that affect crop development and yield. This 4-page fact sheet was written by Clyde Fraisse, and published by the UF Department of Agricultural and Biological Engineering, August 2012. http://edis.ifas.ufl.edu/ae491

Agricultural Management Options for Climate Variability and Change: Variable-Rate Irrigation (AE490)

Figure 1.  Example of management zones in an irrigated field having substantial variability in soil properties and planted areas. Colored zones indicate areas where irrigation is reduced or eliminated.Most fields are not uniform because of natural variations in soil type or topography. When water is applied uniformly to a field, some areas of the field may be overwatered while other areas may remain too dry. Variable-rate irrigation technology gives farmers an automated method to vary rates of irrigation water based on the individual management zones within a field and avoid irrigating roadways, waterways, wetlands, and other non-farmed areas within a pivot. This 3-page fact sheet was written by Calvin Perry, Clyde Fraisse, and Daniel Dourte, and published by the UF Department of Agricultural and Biological Engineering, July 2012.
http://edis.ifas.ufl.edu/ae490

Agricultural Management Options for Climate Variability and Change: Sensor-Based, Variable-Rate Nitrogen Management (AE487)

Clemson-designed variable-rate nitrogen applicator that does not have onboard sensors; NDVI data were collected in a previous trip across the field (right).Nitrogen fertilizer cost represents about 10%–15% of total farm costs for corn, cotton, and wheat in the Southeastern United States. The efficiency of nitrogen use can be highly variable for producers, so a sensor-based, variable-rate nitrogen application (SVNA) system has been developed for irrigated and dryland row crops to reduce production costs. Using sensor-based N application, there is a minimum 20% reduction in N usage. If that rate reduction were applied to all the cotton, corn, and wheat grown in the United States, CO2 emissions from N fertilizer production would be decreased by 2.7 million tons.
This 4-page fact sheet was written by Wesley Porter, Ahmad Khalilian, Daniel Dourte, and Clyde Fraisse, and published by the UF Department of Agricultural and Biological Engineering, July 2012.
http://edis.ifas.ufl.edu/ae487

Agricultural Management Options for Climate Variability and Change: Microirrigation (HS1203)

Figure 1. Drip irrigation applied at the surface for strawberry productionMicroirrigation is the slow, frequent application of water directly to relatively small areas adjacent to individual plants through emitters placed along a water delivery line. A leading advantage of microirrigation is that evaporation that does not contribute to plant growth much less than with sprinkler irrigation. This 5-page fact sheet was written by Lincoln Zotarelli, Clyde Fraisse, and Daniel Dourte, and published by the UF Department of Horticultural Sciences, July 2012.
http://edis.ifas.ufl.edu/hs1203

Agricultural Management Options for Climate Variability and Change: Conservation Tillage (AE486)

Figure 3.  Cover crop rolling and strip tillage in preparation for planting; note the substantial plant residues maintained on the soil surface. Custom roller/strip-till unit by Myron Johnson of Headland, AL.This 4-page fact sheet focuses on the use of conservation tillage in crop production systems as a strategy to minimize the risks associated with climate variability and change and to improve resource-use efficiency. Written by Kip Balkcom, Leah Duzy, Daniel Dourte, and Clyde Fraisse, and published by the UF Department of Agricultural and Biological Engineering, June 2012.
http://edis.ifas.ufl.edu/ae486

What is a Water Footprint?: An Overview and Applications in Agriculture (AE484)

Figure 1. Green, blue, and grey water flows in an agricultural system.Agriculture is by far the largest global consumer of freshwater. Comparing water footprints of different management practices in agriculture can help evaluate drought tolerance, water use efficiency, the effective use of rainfall, and the significance of irrigation. Scientists are thinking about ways to adapt agricultural systems to a changing climate, especially precipitation changes, so the water footprint is a useful measure to compare resilience of agricultural systems to droughts and dry spells. This 11-page fact sheet was written by Daniel R. Dourte and Clyde W. Fraisse, and published by the UF Department of Agricultural and Biological Engineering, January 2012.
http://edis.ifas.ufl.edu/ae484

A Web-Based Tool for Timing Copper Applications in Florida Citrus (PP289)

Figure 1. The main web page of the ‘Citrus Copper Application Scheduler’ and its sections.The Citrus Copper Application Scheduler provides citrus growers with an easy-to-use tool to guide copper application decisions. It is an updated version of a previous copper residue model This 4-page fact sheet was written by Megan M. Dewdney, Clyde W. Fraisse, Tiago Zortea, and Jamie Burrow, and published by the UF Department of Plant Pathology, January 2012.
http://edis.ifas.ufl.edu/pp289

Drought Decision-Support Tools: Introducing the Agricultural Reference Index for Drought — ARID (AE469)

Researchers at the University of Florida have developed a new index called the Agricultural Reference Index for Drought or ARID. ARID is a simple and reliable index to monitor and predict agricultural drought. It is based on a reference crop (grass) and takes into account the soil-plant-atmosphere relationships.
This 5-page fact sheet describes the nuts and bolts of ARID and how to monitor the index on Agroclimate.org. Written by Clyde W. Fraisse, Eduardo M. Gelcer, and Prem Woli, and published by the UF Department of Agricultural and Biological Engineering, February 2011.
http://edis.ifas.ufl.edu/ae469

Drought Decision-Support Tools: Introducing the Lawn and Garden Moisture Index — LGMI (AE470)

Recently, researchers at the University of Alabama developed an index called the Lawn and Garden Moisture Index or LGMI, which monitors the capacity of current soil moisture to sustain healthy lawns and gardens. This 4-page fact sheet explains the nuts and bolds of the LGMI and how to monitor and forecast the index on agroclimate.org. Written by Clyde W. Fraisse, Prem Woli, and Keith T. Ingram, and published by the UF Department of Agricultural and Biological Engineering, February 2011.
http://edis.ifas.ufl.edu/ae470